Our suite of statistical techniques deliver a comprehensive, deconstructed, justified and validated assessment of sensory quality by experts.

An Internal Cuality Map can be used to summarize overall quality scores given to all coffees by all judges. With it, one can quickly identify high and low quality coffees as well as inspect how well the judges are aligned.
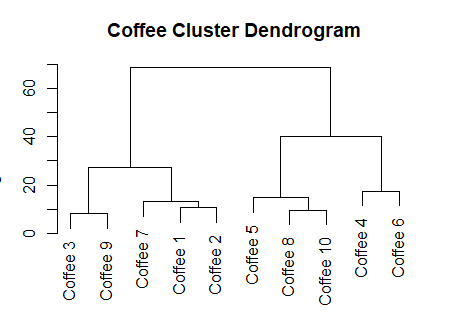
Clustering Analysis, along with the Internal Cuality Map, makes it easy to identifier outliers both in terms of coffee quality as well as judge consistency.

The Sensory Attribute Map can be used to understand how the coffees are different in terms of how they were described by the judges via the Check-All-That-Apply list


Penalty-Lift Analysis of the Check-All-That-Apply attributes gives insight into which attributes are associated with high and low quality coffee.
Word Clouds make for a simple visualization of the CATA attributes that were used to describe each of the coffees.


Visualization of the Just-About-Right selection frequencies allow us to see how the judges favored specific attributes in each coffee.
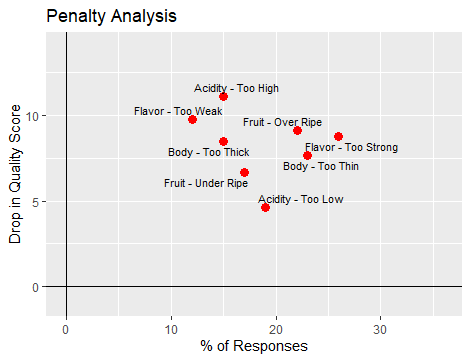
Penalty Analysis of the Just-About-Right attributes shows how quality scores are deviations from the attribute being rated as “Just Right” as well as how often those deviations were cited across all coffees and all judges.